Monday, October 9, 2017

number system introduction


INTRODUCTIONTO NUMBER SYSTEM

In every step of life, we definitely find the use of numbers. If you need to buy something, you will have to pay a certain amount of money for which you will have to count the money. Likewise, the shopkeeper will also count the goods to give you and same for your changes. Therefore, number system can simply be defined as a way to represent numbers.
For example, a number system can be used to represent the number of players in a certain game like 11 players in a football team or for the number of audience for a concert like 25000 concert-goers, etc. So number system can also be viewed as a set of values that is used to represent different quantities.

TYPESOF NUMBER SYSTEM

1) Decimal Number System:
The decimal number system is the most commonly used number system in our daily life. This generally used number system is also known as the base 10 number system because it uses just the 10 symbols i.e. 0 to 9. It is also known as the denary number system because any numeric value there is, these system’s digits can easily represent them.The decimal system is specially used in the computer interface. The weight and position of the digit dictate the value represented by it.

In this system, each number consists of the digits that are located at different positions. The positions of the 1st and the 2nd digits towards the right side of the decimal point are -1 and -2. Similarly, the positions of the 1stand 2nd digits towards the left side of the decimal point are 0 and 1 respectively.

The value of the number is determined by adding the results out of the multiplication of the digits with the weight of their position. This method is called the expansion method. Under this method, the rightmost digit of the number is called the Least Significant Digit (LSD), as it has the lowest weight. Likewise, the leftmost digit of the number is called the Most Significant Digit (MSD), as it has the highest weight.
Examples:

(a) The weights and positions of each digit of the number 796 are as follows:
Positions
2
1
0
Weights
102
101
100
Face value
7
9
6

The above table indicates that:
The value of digit 7 = 7x102=700 
The value of digit 9 = 9x101=90
The value of digit 6 = 6x100=6 
The actual number can be formed by adding the values obtained by the digits as follows:
700+90+6=796
Here, the digit 7 in the number 796 is the most significant digit and 6 is the least significant digit
.

Sunday, October 8, 2017

measurement formula

Rectangle
 
Parallelogram
Triangle
Trapezoid
Circle
Rectangular solid
Prisms
where B is the area of the base and P is the perimeter of the base.
Cylinder.
Pyramid

where B is the area of the base.
To get the surface area of a pyramid, add the area of the base to the sum of the areas of all of the triangular faces. The areas of the triangular faces will have different formulas for different shaped bases.
Cone
Sphere

Saturday, October 7, 2017

measurement intro

Area

Area is the size of a surface: how much is inside the boundary of a flat (2-dimensional) object such as a triangle or circle.
Here Ariel the Dog is waiting patiently inside 1 square metre.
dog inside square meter

liter water

Volume

Volume is the amount of 3-dimensional space an object occupies. Also called Capacity.
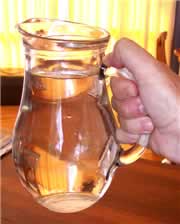
This jug has exactly 1 litre of water in it (slightly more than 2 pints)

Mass (Weight)

Mass is how much matter something contains.
This bar of Gold has a Mass of 1 kilogram (slightly more than 2 pounds)
(Weight is "Heaviness" ... the downward force caused by gravity on an object.)

1 kilogram
ice block 

Temperature

How hot or cold a thing is.
Temperature is measured using a thermometer, usually in the Celsius or Fahrenheit scale.
This block of ice would measure 0° Celsius, or 32° Fahrenheit

Friday, October 6, 2017

statistics intro

Introduction to Statistics

Introduction to Statistics

Statistics is a mathematical science including methods of collecting, organizing and analyzing data in such a way that meaningful conclusions can be drawn from them. In general, its investigations and analyses fall into two broad categories called descriptive and inferential statistics.
Descriptive statistics deals with the processing of data without attempting to draw any inferences from it. The data are presented in the form of tables and graphs. The characteristics of the data are described in simple terms. Events that are dealt with include everyday happenings such as accidents, prices of goods, business, incomes, epidemics, sports data, population data.
Inferential statistics is a scientific discipline that uses mathematical tools to make forecasts and projections by analyzing the given data. This is of use to people employed in such fields as engineering, economics, biology, the social sciences, business, agriculture and communications.

Introduction to Population and Sample

A population often consists of a large group of specifically defined elements. For example, the population of a specific country means all the people living within the boundaries of that country.
Usually, it is not possible or practical to measure data for every element of the population under study. We randomly select a small group of elements from the population and call it a sample. Inferences about the population are then made on the basis of several samples.
Example 1: A company is thinking about buying 50,000 electric batteries from a manufacturer. It will buy the batteries if no more that 1% of the batteries are defective. It is not possible to test each battery in the population of 50,000 batteries since it takes time and costs money. Instead, it will select few samples of 500 batteries each and test them for defects. The results of these tests will then be used to estimate the percentage of defective batteries in the population.

Quantitative and Qualitative Data

Data is quantitative if the observations or measurements made on a given variable of a sample or population have numerical values. 

Example: height, weight, number of children, blood pressure, current, voltage. 

Data is qualitative if words, groups and categories represents the observations or measurements. 

Example: colors, yes-no answers, blood group. 

Quantitative data is discrete if the corresponding data values take discrete values and it is continuous if the data values take continuous values. 

Example of discrete data: number of children, number of cars. 

Example of continuous data: speed, distance, time, pressure.

Thursday, October 5, 2017

trigonometry basics formula

Area of Triangle (Proof)

formulaHalfABsinC.gif [1.1]
In the triangle below, the height is h. The area is:
triangleArea1.gif  [1.2]
(Half the base times the height, of course)
halfBCsinA.gif
h=b·sinC  [1.3]
So substituting in 1.2, we have:
formulaHalfABsinC.gif


Sine Rule (Proof)

Re-using the above triangle, in triangle AXC, 
h/b=sin A
h=b·sin A  [2.1]

In triangle XBC, 
h/a=sin B
h=a·sin B [2.2]

Equating Equations 2.1 and 2.2, we have
h=b·sin A=a·sin B
So, 
b/sin B=a/sin A

Using a perpendicular from A to BC, we can show that 
b/sin B=c/sin C
Hence we have the Sine Rule:
sineRule.gif [2.3]


Cosine Rule (Proof)

The Cosine Rule is:

cosineRuleFormula.gif 

To prove it we use the triangle below:
cosineTriangle.gif

h is the height (CX) and x is the distance AX, and, because AB=c, then XB=c-x

In triangle AXC, by Pythagoras' Theorem:
b2=h2+x2 
h2=b2−x2   [3.2]

In triangle XBC, by Pythagoras' Theorem:

a2=(c-x)2+h2 
a2=c2+x2-2cx+h2  

Substituting the value for h2 in Equation 3.2 in Equation 3.4:


a2=c2+x2−2cx+b2−x2   

The x2 cancels and by slight rearranging:
a2=b2+ c2−2cx 

In triangle AXC, we note:
x=b·cosA   

Using this value in Equation 3.6, we get the Cosine Rule:
cosineRuleFormula.gif

Wednesday, October 4, 2017

trigonometry basics

Trigonometry ... is all abouttriangles.
Trigonometry helps us find angles and distances, and is used a lot in science, engineering, video games, and more!

Right-Angled Triangle

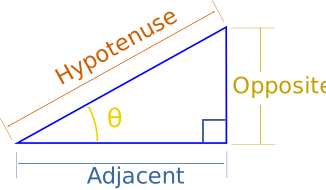
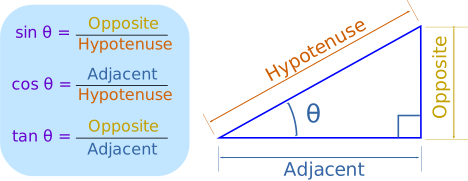
The triangle of most interest is the right-angled triangle. The right angle is shown by the little box in the corner:
triangle showing Opposite, Adjacent and Hypotenuse
Another angle is often labeled θ, and the three sides are then called:
  • Adjacent: adjacent (next to) the angle θ
  • Opposite: opposite the angle θ
  • and the longest side is the Hypotenuse

Why?

Why is this triangle so important?
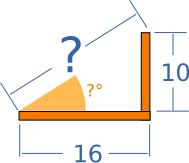
Imagine we can measure along and up but want to know the direct distance and angle:
triangle showing Opposite, Adjacent and Hypotenuse
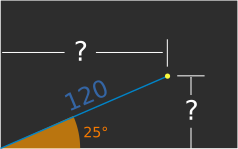
Or we have a distance and angle and need to "plot the dot" along and up:
triangle showing Opposite, Adjacent and Hypotenuse
Questions like these are common in engineering, computer animation and more.
And trigonometry gives the answers!

Sine, Cosine and Tangent

The main functions in trigonometry are Sine, Cosine and Tangent
They are simply one side of a right-angled triangle divided by another.
For any angle "θ":
sin=opposite/hypotenuse cos=adjacent/hypotenuse tan=opposite/adjacent

Sunday, October 1, 2017

statistics formulas

Mean or Average

Mean or average, in theory, is the sum of all the elements of a set divided by the number of elements in the set. Mean could be treated as a collaborative property of the whole set of values. You can get a fairly good idea about the whole set of data by calculating its mean. Thus the formula for mean will become.
Mean = Sum of all the set elements / Number of elements
The importance of mean lies in its ability to summarize the whole dataset with a single value. For example, you may want to compare the average household income of County 1 to County 2. To compare the household incomes between the two counties you cannot compare each and every household income of one county to the other. The best solution would be to find the average household incomes of the two counties and then compare them with each other. By comparing the two means, we may make an assumption as to which county is more prosperous than the other.

Median

Simply put: Median is the middle value of a set. So, if a set consists of odd number of sets, then the middle value is the median of the set, and if the set consists of an even number of sets, then the median is the average of the two middle values. The median may be used to separate a set of data into two parts.
To find the median of a set, all one needs to do is to write the elements of the set in increasing order and find the number of elements then finally find the median. Median can prove to be a very useful property in case of any outliers in the dataset. An outlier is nothing but a very huge aberration in the values specified in the set. For example, if a set consists of values: 1, 2, 3, 4, 10000, then the value 10000 is an outlier. Outliers can make mean values deeply flawed. For example, the mean of the above set is 10010/5=2002 and the median is 3. Thus, we can definitely say that the median most properly summaries the set, better than the mean. You can learn some more about the various statistics formulas and become well acquainted with the topic.

Mode

The mode in a dataset is the value that is most frequent in a dataset. Like mean and median, mode is also used to summarize a set with a single piece of information. For example, the mode of the dataset S = 1,2,3,3,3,3,3,4,4,4,5,5,6,7, is 3 since it occurs the maximum number of times in the set S.
An important property of mode is that it is equal to the value of mean and median in the case of a normal distribution. In other distributions or skewed distributions the value of mode may differ from the two. In normal distributions the data is symmetrical to a central value. A normal distribution curve is a curve that is symmetrical to an axis. Another important property of normal distributions is that half of the values in the set are larger than the mean and half are smaller.

Variance

You may want to measure the deviation of a set of data from the mean value. For example, a huge variance of the household income data of a country may be interpreted as an economy with high inequality. Many useful interpretations can be carried out by analyzing the variance in data. The variance is obtained by:
  1. Finding out the difference between the mean value and all the values in the set.
  2. Squaring those differences.
  3. Adding the differences.
Thus, one can observe that the variance of the particular dataset is always positive. The most proper use of variance is its use in the calculation of Standard Deviation, which is one of the most important concepts of statistics. Also, the calculation of variance can be lengthy; you may want to take up a course on Vedic Mathematics which will teach you on how you can do the calculations faster.

Standard Deviation

The standard deviation is calculated by square rooting the variance of the data. The standard deviation gives a more accurate account of the dispersion of values in a dataset. Since variance is obtained by squaring the values, it cannot be applied to real world calculations. Standard deviation is calculated by obtaining the square root of the variance which is of the same unit as the elements of the set. Hence, Standard Deviation can be used as a trusted statistical quantity to make proper statistical calculations. Standard deviation is also related to probability in many ways, so you may like to take a workshop on probability and statistics to explore more about the relation between the two topics.
A standard use of deviation is finding out how much the values of the dataset differ from the mean.